Video Source: FreeNZ Media
In the above video, NZ Loyal Party leader Liz Gunn interviews government whistleblower “Winston Smith,” who provides “undeniable” evidence that New Zealand is experiencing an unprecedented rise in excess deaths since the Pfizer mRNA gene therapy rollout. Winston displays simple-to-understand graphs that clearly show the days in which much more people died than normal, and the locations in which the highest percentage of deaths occurred after vaccination.
RELATED POST: New Report: Young People Dying of Cancer at ‘Explosive’ Rates, UK Government Data Show
Gunn performed two subsequent interviews with Smith to dive deeper into the data analysis. The first interview included Dr Paul Oosterhuis of Australia (see HERE), and the second one included UK MP Andrew Bridgen (see HERE).
Winston Smith (not his real name – it’s the name of the protagonist in the book “1984”) had access to official government vaccination data as part of his role in a project to implement a payment system in which providers are paid a sum of money every time they vaccinate a patient for COVID. He also had access to the country’s birth and death data.
Regarding the jab payment tracking system, Smith said: “I helped build it. I implemented it. And when I was looking at the data, which is part of my job, I noticed some discrepancies with the dates of death – people dying within a week of being vaccinated… This prompted my curiosity a bit and I dug a little deeper.”
After digging deeper, Smith concluded: “It is the vaccine that is killing people. It’s got to be, there’s nothing else… they can claim it’s anything – the aging population or whatever. It’s not. This thing is a killer.”
Smith graphed the days in which more than 120 people died. The figure of 120 was chosen as it was highly unusual for there to be that many deaths in New Zealand on a given day before the jab rollout. Historically days where 120 deaths or more were recorded were rare. In 2020 there were none. 2021 was also a quiet year until the mRNA rollout. From that point forward the number of days in which 120+ deaths were recorded increased dramatically. See below:

As you can see, there is a large cluster of thick lines representing the 120+ days starting in 2022 and continuing to the present day. Smith observed:
“You would expect to see the black lines disappear because no one’s dying from COVID anymore right? But you’re not. You’re absolutely not. You’re seeing the black lines. There are more people dying than ever before. These are the biggest numbers of deaths we’ve seen in the history of New Zealand.”
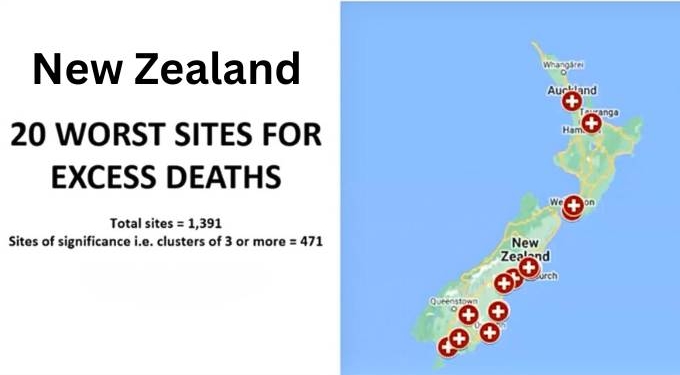
Smith also displayed the death rates for particular sites and vaccination centers, with ‘clustering’ observed in rest homes and South Island mobile vaccination ‘hubs’. See the two graphs below:


Smith also provided a chart of the most deadly Pfizer batches:

As you can see, Smith noted on the bottom of the above chart: “CHANCES OF THESE BATCHES NOT BEING A KILLER ARE 100 BILLION TO ONE!”


